Simulators
- What is GNS3?

- What is GNS3? “Graphical Network Simulator” to be precise
- GNS3, also known as GNS is a graphical network simulator; A free networking tool that allows us to graphically & practically simulate complex networks scenarios. GNS is a package containing multiple programs & not just a single program.
- Now that I know about What GNS is, What are the various Uses of GNS?
- GNS3 is an excellent tool to recreate/simulate real lab scenarios for network engineers, designers, administrators and students/professionals looking ahead to pass various Networking Certifications like Cisco’s CCNA, CCNP, CCIP, CCIE; Juniper’s JNCIA, JNCIS, JNCIE.
- Another excellent use is to test drive configurations for latest features of Cisco IOS, Juniper JunOS or to verify configs created to be deployed on live routers.
Where Do I get the software required to simulate the network?
Well, You are on Your own here. Users have to arrange IOS/IPS/PIX/ASA/JunOS software on their own.
These are proprietary & copyrighted softwares that can not be distributed freely. If You have valid contracts, You can always legally arrange them. You can also find them being offered illegally on P2P [Torrent SItes] / Other type of File sharing sites.
You’ll not find it here at Cisco Tutorial. Hope You understand.
What all programs are used by GNS?
GNS3 comprises of multiple programs, that are now merged into this package.
The core components that GNS comprises of are
Dynamips – The core program that allows emulation of real Cisco IOS software.
Dynagen – A text-based front-end that was deigned for Dynamips.
Qemu – A generic open source machine emulator and virtualizer.
What all Operating Systems Support GNS?
GNS can be used on all popular operating systems like.
Windows
Linux
MacOS X
Packet Capture
In this article, we shall cover the basic working of a sniffer, to capture packets for analyzing the traffic. If
an analyst does not have working skills of a packet sniffer to a certain level, it is really hard to defend
intrusions. This article would help the analyst to prepare to the level of what is required for basic packet
collection and basic analysis, but not everything about sniffers. An in depth article on sniffer’s using packet
crafting and packet capture will be coming soon. In this document we are using Wireshark Version 0.99.5
(SVN Rev 20677).
What you will learn...
• Introduction to Sniffer
• Capturing Traffic
• Wireshark basics: The different panes
Packet sniffer’s, are protocol analyzers meant to capture the packets that are seen by a machine’s network
interface. When a sniffer runs on a system, it grabs all the packets that come into and goes out of the
Network Interface Card (NIC) of the machine on which the sniffer is installed. This means that, if the NIC
is set to the promiscuous mode, then it will receive all the packets sent to the network if that network is
connected by a hub. Unfortunately, in a switched network, since switches do not broadcast the packets,
sniffers cannot see any packet that is not having the destination address of the machine on which it is
installed. This is unfortunate for testing reasons, but fortunate for security reasons. It is fortunate because, if
an attacker installs a sniffer in a trusted network, but if the trusted network uses a hub to broadcast the
packets within that network, then the sniffer would be able to look at every single packet that is going
across the network. Now that we have seen the logic of a packet sniffer, let us now look into the details and
working of the sniffer. One of the most common packet-sniffer is Ethereal, which is now known as
Wireshark, but the old functionalities are still maintained and new features are added once in a while.
The above image (Figure 1) shows the opening page of Wireshark (formerly Ethereal). Depending on how
you would like to capture the packet, there are several ways to perform tasks to attain solutions. To start
with, we can choose the “Capture” menu and see what is in there. As the name implies, “Capture” menu is
provided for the users to perform Packet Capture, and it also provides several options for suiting the
situations and the conditions that the analysts have in the mind while performing the process of capturing
the packets. Analysts could even set filters to avoid capturing unwanted traffic. This article would cover
effective Packet Capture for signature generation, by setting the values that are required for optimizing the
outcome.
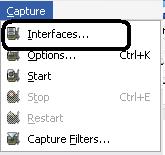
Figure 2. Wireshark Capture Tab
In Figure 2, choose the “Interfaces…” sub-menu in the “Capture” drop-down listing. Once you choose this,
you will have the listing of various network interfaces in your machine that can be seen from your NIC. An
example is shown in Figure 3, where we have five interfaces, of which two of them belong to the VMWare
interfaces, and other two belong to the Ethernet and Wireless interfaces, and finally the default dial-up
interface which is shown as unknown as it is not set.
Figure 3. Wireshark Capture Interfaces
Once you
In Figure 2, choose the “Interfaces…” sub-menu in the “Capture” drop-down listing. Once you choose this,
you will have the listing of various network interfaces in your machine that can be seen from your NIC. An
example is shown in Figure 3, where we have five interfaces, of which two of them belong to the VMWare
interfaces, and other two belong to the Ethernet and Wireless interfaces, and finally the default dial-up
interface which is shown as unknown as it is not set.

Once you have decided the interface that you would like sniff, you can either start sniffing by pushing the
“Start” button in the interfaces window as shown in Figure 3, or you could use the “Options” to choose
more options on sniffing a particular interface, or you could go into the details and check more details on
the interface.

Users can choose the option to view the packets when capturing them simultaneously. This can be done by
two ways. One of which is to choose the “Options” button from Figure 4, and then going into the Capture
Options window as shown in Figure 6.

In Figure 6, there is a highlighted option that says “Update list of packets in real time” is a checkbox option
for users to choose based on what they would like to do. Checking this option would help the user to view
the packet contents while the packets are being sniffed. This option is not usually chosen by default, and
hence the users would have to choose this option only when required and click on “Start” after choosing the
option. Figure 7, shows the capture and the packet contents in the background that are taking place
simultaneously once the users choose the above shown option.

There is another way to reach the “Capture Options” window from the menu bar. There might be many
other ways to open a window or two change options, but in this document we will discuss one or two
options to leave the choice to the analyst. In the menu bar, choose the “Capture” menu and the “Options”
from the drop-down list. This will take you to the “Capture Options” window in Figure 6. Figure 8, shows
the “Options” in the drop-down list, which is generated from the “Capture” menu.

Now that, we have seen how to work with the packet sniffer let us work with an exploit sample to make it
clearer. Even before sniffing packets, analyst should initiate connects from the attacker to the victim and set
up the connection for the packets to flow. In some cases, the analyst might have to use some sort of
listening software from the victim’s end if there is no such service that is exploited by the attacker. But in
such a case, the analyst would have to tweak the exploit code in such a way that the exploit just takes place
without waiting for a response from the victim. This is because, if we use a tool as a listening device, it just
listens to that port in that victim machine and hence it cannot act as handshake software, by responding to
what the exploit wants in order for it to initiate. Netcat is a good tool that could be used as a listener as well
as for various other connectivity solutions between networks or between workstations in the same network.
In the above parts of the packet sniffing, we have seen how to capture the packets. Now we need to
understand the various windows that our Wireshark packet sniffer has provided to all of their users or
analysts to make use of to view and analyze packets. Figure 9, shows the Wireshark packet sniffer with
some opened traffic capture that is being analyzed. As you can see, there are three different panes.

Figure 9. Wireshark Panes
Figure 10 shows the topmost pane (from Figure 9), which is the “Packet List Pane”. This pane as the name
implies, lists the packets that has been captured over the period that we asked Wireshark to capture the
traffic.
Figure 10. Packet List Pane
Following the “Packet List Pane”, we have the second pane in which the details of the packet are displayed.
The contents of this pane changes based on the line you are choosing in the “Packet List Pane” and hence
you can think of the analogy as, “Packet Details Pane” displays the details of the packet based on the line
chosen on the “Packet List Pane”. Figure 11, shows the “Packet Details Pane” for the packet chosen in
“Packet List Pane”.
Figure 11. Packet Details Pane
The third pane is the “Packet Bytes Pane” displays the contents of a packet in Hex and its corresponding
ASCII in the right extreme column. Figure 12, shows the “Packet Bytes Pane”. The contents of “Packet
Bytes Pane” will change based on the content (line/packet) chosen in the “Packet List Pane”.
Figure 12. Packet Bytes Pane
Now that we have seen the various windows and panes in Wireshark, lets see the basic working for our
users to understand the working of a Wireshark with a more practical perspective. Wireshark can capture
packets when the system’s NIC act in promiscuous mode so as to receive every packet floating around the
subnet of that network depending on the device that is used in the network (hub or switch, as defined at the
very beginning). Wireshark is also opened for reviewing and analyzing captured PCAP files. In the
following example, let us consider a set up where there are two virtual machines running in parallel
(remember, for this to work you might require a high memory/RAM size, approximately 2GB gives a really
good performance). Figure 13, shows a sample virtual environment that is created for sniffing packets of
exploits traversing across networks.
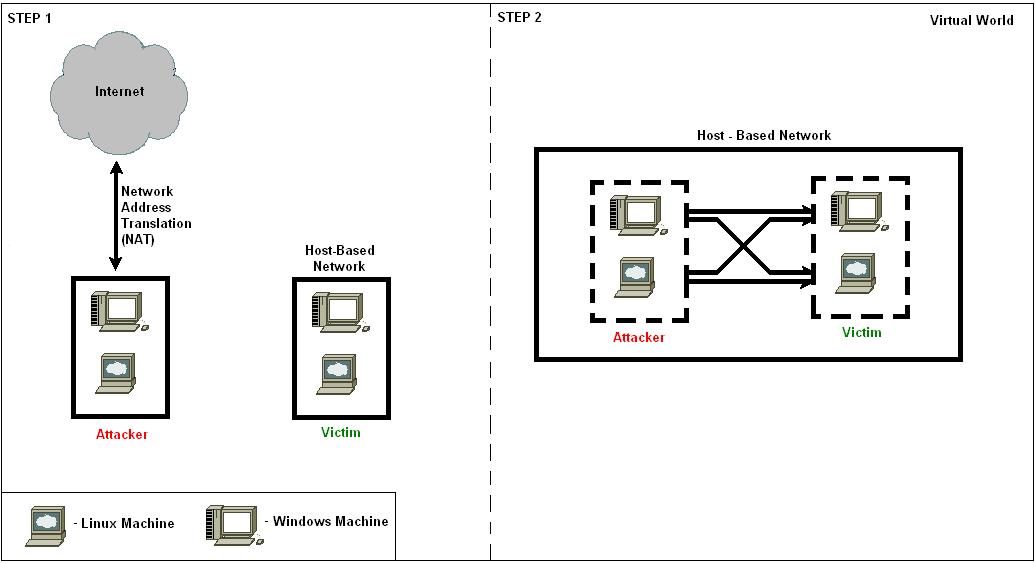
Figure 13. Virtual environment for packet sniffing
In Step 1(Figure 13), the attacker that could be either Linux or Windows machine as shown goes out to the
Internet and downloads an exploit, as shown in Figure 14. This a client-side ActiveX exploit downloaded
from www.milw0rm.com. Once this is done, the attacker then changes the Ethernet mode from NAT to
Host-only mode in the VMWare (Note: More info on this can be found on the VMWare article). In the
host-only mode, try testing if the attacker system and victim system are connected by pinging each other
and also try pinging the outside world to identify any leakages before running the exploit so that this will
not be harmful. Once this set up is done, run the packet sniffer from the host system (system on which these
virtual machines are running) and set the interface as the VMnet (whichever is given on the options for the
sniffer to capture traffic that is going within the vmnet). Once all the set up is done, the packets running
across can be captured and once this is done, stop the capture mode and start analyzing the packets.

=Once the packets are captured, filters can be placed in the captured PCAP files to see only the required
packet traces. One way is by right clicking on a packet that you wish to find the trace for and choose the
“Follow TCP Stream” option. The following window in Figure 15, is a sample for TCP stream (though this
is NOT the TCP stream of the exploit seen above). Here the user has the option to choose the ASCII,
EBCDIC, Hex Dump, C Arrays and Raw modes of the packet trace and the user can also Save this view as
is in a separate file or print the view as seen by the user. These help the analysts to view and analyze the
packets in the way they are comfortable with.

Conclusion:
This document should help the users to understand and use packet sniffer like Wireshark and user would
also have understood the various options and how to use them according to their need.
NOTE: This is for educational purpose only. If you/user or anyone/reader or reader’s
acquaintance uses the skill learnt from here (from this article or from
www.EvilFingers.com) for any malicious or illegitimate/illegal purposes, EvilFingers or
any of the team members are not responsible for any of the after effects or any of your
acts. Read up on “Legal” Section of www.EvilFingers.com before you use any parts of
this article.


